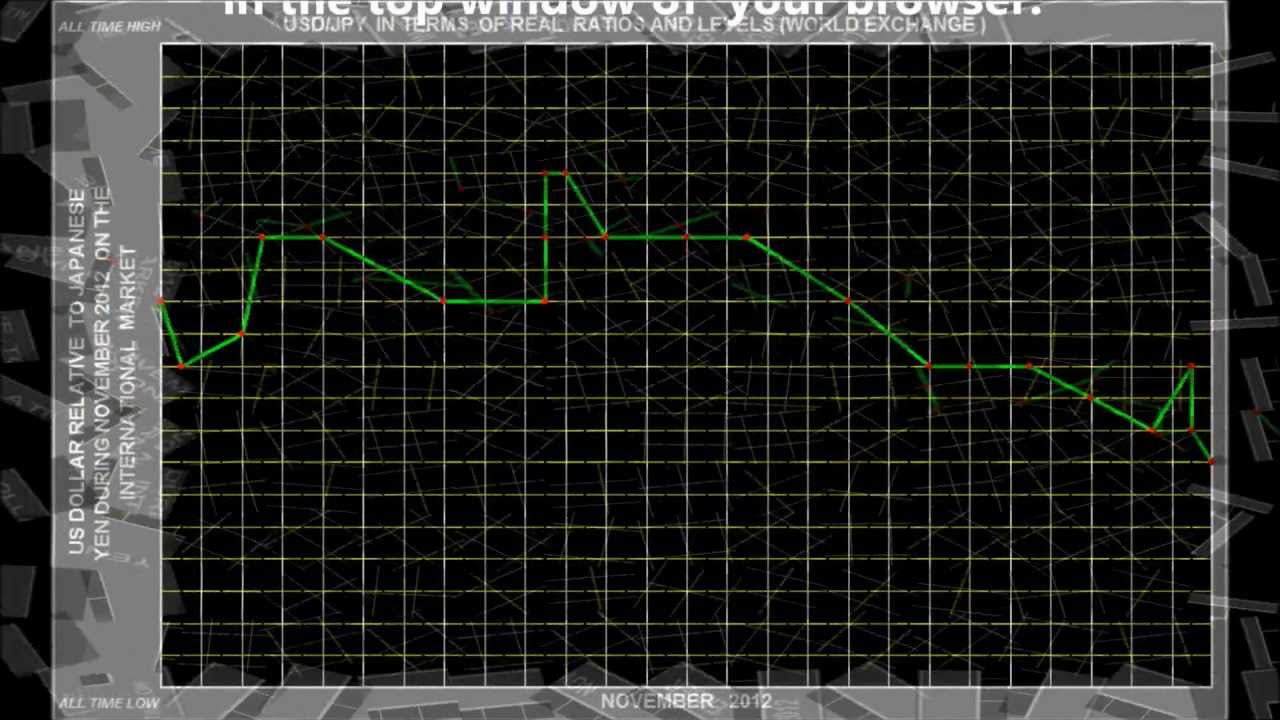
Forex trading charts enable a trader to evaluate market patterns so a good trade can be entered. The three most common are line charts, bar charts, and the most popular one, candle stick charts. Charts not only plot the price against a particular time frame, but also contain volumes of historical data.
Line charts include a simple line revealing price action in time. Bar charts and candle sticks give additional information including open, close, high, and low in a given time period. Forex trading charts are basic to foreign currency trading. They are the starting point from which traders add templates, indicators, and expert advisors (EAs) to enhance their trading.
Although there are those who prefer to trade with a clean bar chart, using price action and support/resistance to formulate trades, for most traders the lure of numerous exotic indicators and EAs is great. With the click of a mouse you can begin to design your own forex trading charts. Then you can name and save them for reproducing easily on other currency pairs.
It is better to begin with one of the major pairs. When you first bring up a chart on Metatrader MT4, by default you get a l hour bar chart. You can view charts in time intervals from 1 minute, 5 minute, 15 minute, 30 minute, 1 hour, 4 hour, daily, weekly, to monthly on the most common charts. At the click of a mouse, you can navigate from one time frame to another.
When the default 1 hour bar chart comes up, the bars are green on a black background with a white grid. When you right click on the chart and then at the bottom click on properties, you are given every possible shade of color. You can customize forex trading charts to your liking. It will make trading easier if you use a combination that is easy on your eyes and colors that highlight the indicators most interesting to you.
By inserting colors that show rise and fall of price in different colors, like green for rising price and red for falling price, you can see in an moment the information you need to enter or exit a trade.
Your decision on which forex trading charts to use depends on the amount of time you can devote to trading. Day trading which utilizes the lower time frames, takes more time to watch than trading the daily charts. On the other hand, there are strategies that instruct a trader in how to spend only a few minutes at each trading day’s end to set up a trade.
You will find yourself looking at several of the higher time frames when you day trade on 15 or 30 minute charts, to determine the overall trend. There is software available to put on your chart showing the trends of 5 or 6 time frames at once. It is a big help to a trader to always know the trend of the next 2 or 3 higher time frames.
You can get a tremendous education on forex by going back on a chart to see how the market reacted at certain times.
This hands on experience will increase your ability to spot those trading patterns that most often point to a good trade.
Continually increasing your knowledge of forex trading charts can increase your profits. Because they are the foundation of all foreign currency trading, make it your aim to learn something new about them every day.


